
20 Better transport
Modern vehicle technology can reduce climate change emissions without changing the look, feel or performance that owners have come to expect.
California Air Resources Board
Roughly one third of our energy goes into transportation. Can technology deliver a reduction in consumption? In this chapter we explore options for achieving two goals: to deliver the biggest possible reduction in transport’s energy use, and to eliminate fossil fuel use in transport.
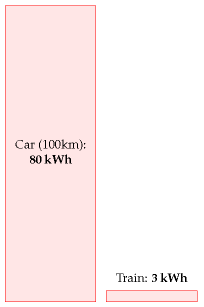
Transport featured in three of our consumption chapters: Chapter 3 (cars), Chapter 5 (planes), and Chapter 15 (road freight and sea freight). So there are two sorts of transport to address: passenger transport, and freight. Our unit of passenger transport is the passenger-kilometre (p-km). If a car carries one person a distance of 100 km, it delivers 100 p-km of transportation. If it carries four people the same distance, it has delivered 400 p-km. Similarly our unit of freight transport is the ton-km (t-km). If a truck carries 5 t of cargo a distance of 100 km then it has delivered 500 t-km of freight-transport. We’ll measure the energy consumption of passenger transport in “kWh per 100 passenger-kilometres,” and the energy consumption of freight in “kWh per ton-km.” Notice that these measures are the other way up compared to “miles per gallon”: whereas we like vehicles to deliver many miles per gallon, we want energy-consumption to be few kWh per 100 p-km.
We’ll start this chapter by discussing how to reduce the energy consumption of surface transport. To understand how to reduce energy consumption, we need to understand where the energy is going in surface transport. Here are the three key concepts, which are explained in more detail in Technical Chapter A.
In short-distance travel with lots of starting and stopping, the energy mainly goes into speeding up the vehicle and its contents. Key strategies for consuming less in this sort of transportation are therefore to weigh less, and to go further between stops. Regenerative braking, which captures energy when slowing down, may help too. In addition, it helps to move slower, and to move less.
In long-distance travel at steady speed, by train or automobile, most of the energy goes into making air swirl around, because you only have to accelerate the vehicle once. The key strategies for consuming less in this sort of transportation are therefore to move slower, and to move less, and to use long, thin vehicles.
In all forms of travel, there’s an energy-conversion chain, which takes energy in some sort of fuel and uses some of it to push the vehicle forwards. Inevitably this energy chain has inefficiencies. In a standard fossil-fuel car, for example, only 25% is used for pushing, and roughly 75% of the energy is lost in making the engine and radiator hot. So a final strategy for consuming less energy is to make the energy-conversion chain more efficient.
These observations lead us to six principles of vehicle design and vehicle use for more-efficient surface transport: a) reduce the frontal area per person; b) reduce the vehicle’s weight per person; c) when travelling, go at a steady speed and avoid using brakes; d) travel more slowly; e) travel less; and f) make the energy chain more efficient. We’ll now discuss a variety of ways to apply these principles.
How to roll better

A widely quoted statistic says something along the lines of “only 1 percent of the energy used by a car goes into moving the driver” 1 – the implication being that, surely, by being a bit smarter, we could make cars 100 times more efficient? The answer is yes, almost, but only by applying the principles of vehicle design and vehicle use, listed above, to extreme degrees.
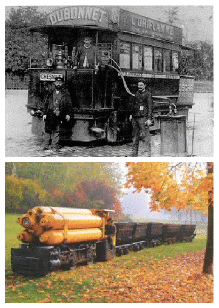
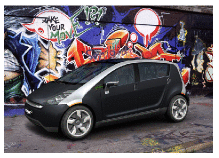
One illustration of extreme vehicle design is an eco-car, which has small frontal area and low weight, and – if any records are to be broken – is carefully driven at a low and steady speed. The Team Crocodile eco-car (figure 20.2) does 2184 miles per gallon (1.3 kWh per 100 km) at a speed of 15 mph (24 km/h). Weighing 50 kg and shorter in height than a traffic cone, it comfortably accommodates one teenage driver.
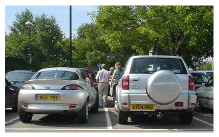
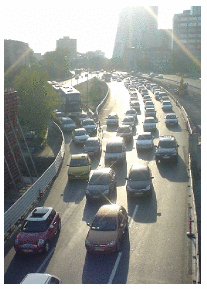
Hmm. I think that the driver of the urban tractor in figure 20.1 might detect a change in “look, feel and performance” if we switched them to the eco-car and instructed them to keep their speed below 15 miles per hour. So, the idea that cars could easily be 100 times more energy efficient is a myth. We’ll come back to the challenge of making energy-efficient cars in a moment. But first, let’s see some other ways of satisfying the principles of more-efficient surface transport.
Figure 20.3 shows a multi-passenger vehicle that is at least 25 times more energy-efficient than a standard petrol car: a bicycle. The bicycle’s performance (in terms of energy per distance) is about the same as the ecocar’s. 2 Its speed is the same, its mass is lower than the eco-car’s (because the human replaces the fuel tank and engine), and its effective frontal area is higher, because the cyclist is not so well streamlined as the eco-car.
Figure 20.4 shows another possible replacement for the petrol car: a train, with an energy-cost, if full, of 1.6 kWh per 100 passenger-km. In contrast to the eco-car and the bicycle, trains manage to achieve outstanding efficiency without travelling slowly, and without having a low weight per person. Trains make up for their high speed and heavy frame by exploiting the principle of small frontal area per person. Whereas a cyclist and a regular car have effective frontal areas of about 0.8 m2 and 0.5 m2 respectively, a full commuter train from Cambridge to London has a frontal area per passenger of 0.02 m2.
But whoops, now we’ve broached an ugly topic – the prospect of sharing a vehicle with “all those horrible people.” Well, squish aboard, and let’s ask: How much could consumption be reduced by a switch from personal gas-guzzlers to excellent integrated public transport?
Public transport
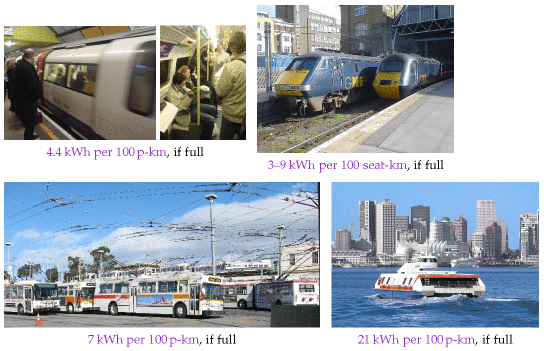
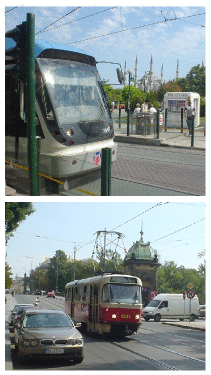
At its best, shared public transport is far more energy-efficient than individual car-driving. A diesel-powered coach, carrying 49 passengers and doing 10 miles per gallon at 65 miles per hour, uses 6 kWh per 100 p-km – 13 times better than the single-person car. Vancouver’s trolleybuses consume 270 kWh per 100 vehicle-km, and have an average speed of 15 km/h. If the trolleybus has 40 passengers on board, then its passenger transport cost is 7 kWh per 100 p-km. The Vancouver SeaBus has a transport cost of 83 kWh per vehicle-km at a speed of 13.5 km/h. It can seat 400 people, so its passenger transport cost when full is 21 kWh per 100 p-km. London underground trains, at peak times, use 4.4 kWh per 100 p-km – 18 times better than individual cars. 4 Even high-speed trains, 5 which violate two of our energy-saving principles by going twice as fast as the car and weighing a lot, are much more energy efficient: if the electric high-speed train is full, its energy cost is 3 kWh per 100 p-km – that’s 27 times smaller than the car’s!
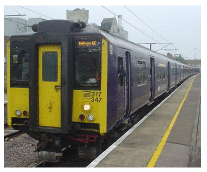
However, we must be realistic in our planning. Some trains, coaches, and buses are not full (figure 20.6). So the average energy cost of public transport is bigger than the best-case figures just mentioned. What’s the average energy-consumption of public transport systems, and what’s a realistic appraisal of how good they could be?
In 2006–7, the total energy cost of all London’s underground trains, including lighting, lifts, depots, and workshops, was 15 kWh per 100 p-km 6 – five times better than our baseline car. In 2006–7 the energy cost of all London buses was 32 kWh per 100 p-km. Energy cost is not the only thing that matters, of course. Passengers care about speed: and the underground trains delivered higher speeds (an average of 33 km/h) than buses (18 km/h). Managers care about financial costs: the staff costs, per passenger-km, of underground trains are less than those of buses.
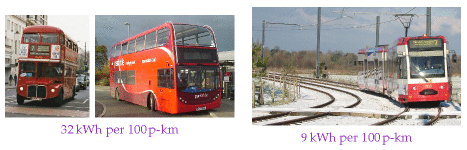
The total energy consumption of the Croydon Tramlink system (figure 20.7) in 2006–7 (including the tram depot and facilities at tram-stops) was 9 kWh per 100 p-km, with an average speed of 25 km/h. 7
Energy consumption (kWh per 100 p-km)
Car
68
Bus
19
Rail
6
Air
51
Sea
57
Table 20.8. Overall transport efficiencies of transport modes in Japan (1999).How good could public transport be? Perhaps we can get a rough indication by looking at the data from Japan in table 20.8. At 19 kWh per 100 p-km and 6 kWh per 100 p-km, bus and rail both look promising. Rail has the nice advantage that it can solve both of our goals – reduction in energy consumption, and independence from fossil fuels. Buses and coaches have obvious advantages of simplicity and flexibility, but keeping this flexibility at the same time as getting buses and coaches to work without fossil fuels may be a challenge.
To summarise, public transport (especially electric trains, trams, and buses) seems a promising way to deliver passenger transportation – better in terms of energy per passenger-km, perhaps five or ten times better than cars. However, if people demand the flexibility of a private vehicle, what are our other options?
Private vehicles: technology, legislation, and incentives
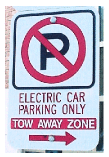
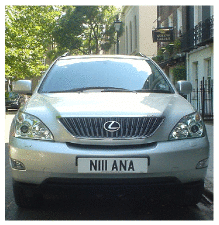
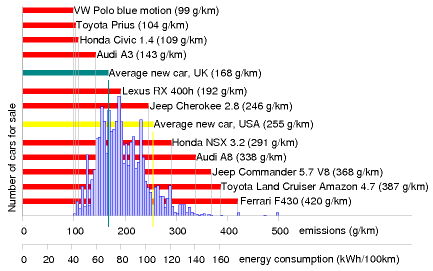
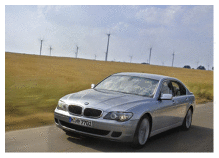
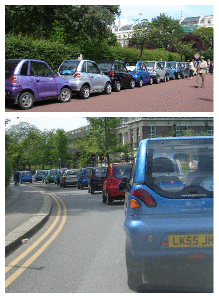
The energy consumption of individual cars can be reduced. The wide range of energy efficiencies of cars for sale proves this. In a single showroom in 2006 you could buy a Honda Civic 1.4 that uses roughly 44 kWh per 100 km, or a Honda NSX 3.2 that uses 116 kWh per 100 km (figure 20.9). The fact that people merrily buy from this wide range is also proof that we need extra incentives and legislation to encourage the blithe consumer to choose more energy-efficient cars. There are various ways to help consumers prefer the Honda Civic over the Honda NSX 3.2 gas-guzzler: raising the price of fuel; cranking up the showroom tax (the tax on new cars) in proportion to the predicted lifetime consumption of the vehicle; cranking up the road-tax on gas guzzlers; parking privileges for economical cars (figure 20.10); or fuel rationing. All such measures are unpopular with at least some voters. Perhaps a better legislative tactic would be to enforce reasonable energy-efficiency, rather than continuing to allow unconstrained choice; for example, we could simply ban, from a certain date, the sale of any car whose energy consumption is more than 80 kWh per 100 km; and then, over time, reduce this ceiling to 60 kWh per 100 km, then 40 kWh per 100 km, and beyond. Alternatively, to give the consumer more choice, regulations could force car manufacturers to reduce the average energy consumption of all the cars they sell. Additional legislation limiting the weight and frontal area of vehicles would simultaneously reduce fuel consumption and improve safety for other road-users (figure 20.11). People today choose their cars to make fashion statements. With strong efficiency legislation, there could still be a wide choice of fashions; they’d all just happen to be energy-efficient. You could choose any colour, as long as it was green.
While we wait for the voters and politicians to agree to legislate for efficient cars, what other options are available?
Bikes
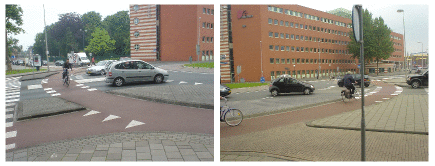
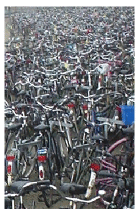
My favourite suggestion is the provision of excellent cycle facilities, along with appropriate legislation (lower speed-limits, and collision regulations that favour cyclists, for example). 8 Figure 20.12 shows a roundabout in Enschede, Netherlands. There are two circles: the one for cars lies inside the one for bikes, with a comfortable car’s length separating the two. The priority rules are the same as those of a British roundabout, except that cars exiting the central circle must give way to circulating cyclists (just as British cars give way to pedestrians on zebra crossings). Where excellent cycling facilities are provided, people will use them, as evidenced by the infinite number of cycles sitting outside the Enschede railway station (figure 20.13).
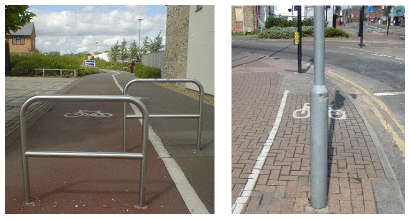
Somehow, British cycle provision (figure 20.14) doesn’t live up to the Dutch standard.

In the French city of Lyon, a privately-run public bicycle network, V´elo’v, was introduced in 2005 and has proved popular. Lyon’s population of 470 000 inhabitants is served by 2000 bikes distributed around 175 cycle-stations in an area of 50 km2 (figure 20.15). In the city centre, you’re usually within 400 metres of a cycle-station. Users join the scheme by paying a subscription fee of €10 per year and may then hire bicycles free for all trips lasting less than 30 minutes. For longer hire periods, users pay up to €1 per hour. Short-term visitors to Lyon can buy one-week subscriptions for €1.
Other legislative opportunities
Speed limits are a simple knob that could be twiddled. As a rule, cars that travel slower use less energy (see Chapter A). With practice, drivers can learn to drive more economically: using the accelerator and brake less and always driving in the highest possible gear can give a 20% reduction in fuel consumption.
Another way to reduce fuel consumption is to reduce congestion. Stopping and starting, speeding up and slowing down, is a much less efficient way to get around than driving smoothly. Idling in stationary traffic is an especially poor deliverer of miles per gallon!
Congestion occurs when there are too many vehicles on the roads. So one simple way to reduce congestion is to group travellers into fewer vehicles. A striking way to think about a switch from cars to coaches is to calculate the road area required by the two modes. Take a trunk road on the verge of congestion, where the desired speed is 60 mph. The safe distance from one car to the next at 60 mph is 77 m. If we assume there’s one car every 80 m and that each car contains 1.6 people, then vacuuming up 40 people into a single coach frees up two kilometres of road!
Congestion can be reduced by providing good alternatives (cycle lanes, public transport), and by charging road users extra if they contribute to congestion. In this chapter’s notes I describe a fair and simple method for handling congestion-charging. 9
Enhancing cars
Assuming that the developed world’s love-affair with the car is not about to be broken off, what are the technologies that can deliver significant energy savings? Savings of 10% or 20% are easy – we’ve already discussed some ways to achieve them, such as making cars smaller and lighter. Another option is to switch from petrol to diesel. Diesel engines are more expensive to make, but they tend to be more fuel-efficient. But are there technologies that can radically increase the efficiency of the energy-conversion chain? (Recall that in a standard petrol car, 75% of the energy is turned nto heat and blown out of the radiator!) And what about the goal of getting off fossil fuels?
In this section, we’ll discuss five technologies: regenerative braking; hybrid cars; electric cars; hydrogen-powered cars; and compressed-air cars.
Regenerative braking
There are four ways to capture energy as a vehicle slows down.
An electric generator coupled to the wheels can charge up an electric battery or supercapacitor.
Hydraulic motors driven by the wheels can make compressed air, stored in a small canister.
Energy can be stored in a flywheel.
Braking energy can be stored as gravitational energy by driving the vehicle up a ramp whenever you want to slow down. This gravitational energy storage option is rather inflexible, since there must be a ramp in the right place. It’s an option that’s most useful for trains, and it is illustrated by the London Underground’s Victoria line, which has hump-back stations. Each station is at the top of a hill in the track. Arriving trains are automatically slowed down by the hill, and departing trains are accelerated as they go down the far side of the hill. The hump-back-station design provides an energy saving of 5% and makes the trains run 9% faster.
Electric regenerative braking (using a battery to store the energy) salvages roughly 50% of the car’s energy in a braking event, leading to perhaps a 20% reduction in the energy cost of city driving.
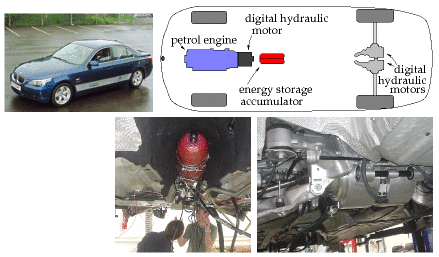
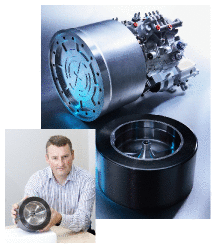
Regenerative systems using flywheels and hydraulics seem to work a little better than battery-based systems, salvaging at least 70% of the braking energy. 10 Figure 20.17 describes a hybrid car with a petrol engine powering digitally-controlled hydraulics. On a standard driving cycle, this car uses 30% less fuel than the original petrol car. In urban driving, its energy consumption is halved, from 131 kWh per 100 km to 62 kWh per 100 km (20 mpg to 43 mpg). (Credit for this performance improvement must be shared between regenerative braking and the use of hybrid technology.) Hydraulics and flywheels are both promising ways to handle regenerative braking because small systems can handle large powers. A flywheel system weighing just 24 kg (figure 20.18), designed for energy storage in a racing car, can store 400 kJ (0.1 kWh) of energy – enough energy to accelerate an ordinary car up to 60 miles per hour (97 km/h); and it can accept or deliver 60 kW of power. Electric batteries capable of delivering that much power would weigh about 200 kg. 11 So, unless you’re already carrying that much battery on board, an electrical regenerative-braking system should probably use capacitors to store braking energy. Super-capacitors have similar energy-storage and power-delivery parameters to the flywheel’s.
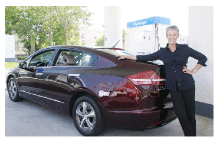
Hybrid cars
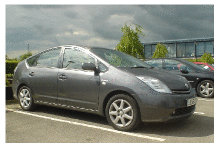
Hybrid cars such as the Toyota Prius (figure 20.19) have more-efficient engines and electric regenerative braking, but to be honest, today’s hybrid vehicles don’t really stand out from the crowd (figure 20.9).
The horizontal bars in figure 20.9 highlight a few cars including two hybrids. Whereas the average new car in the UK emits 168 g, 12 the hybrid Prius 13 emits about 100 g of CO2 per km, as do several other non-hybrid vehicles – the VW Polo blue motion emits 99 g/km, and there’s a Smart car that emits 88 g/km.
The Lexus RX 400h is the second hybrid, advertised with the slogan “LOW POLLUTION. ZERO GUILT.” But its CO2 emissions are 192 g/km – worse than the average UK car! The advertising standards authority ruled that this advertisement breached the advertising codes on Truthfulness, Comparisons and Environmental claims. “We considered that … readers were likely to understand that the car caused little or no harm to the environment, which was not the case, and had low emissions in comparison with all cars, which was also not the case.”
In practice, hybrid technologies seem to give fuel savings of 20 or 30%. 14 So neither these petrol/electric hybrids, nor the petrol/hydraulic hybrid featured in figure 20.17 seems to me to have really cracked the transport challenge. A 30% reduction in fossil-fuel consumption is impressive, but it’s not enough by this book’s standards. Our opening assumption was that we want to get off fossil fuels, or at least to reduce fossil fuel use by 90%. Can this goal be achieved without reverting to bicycles?
Electric vehicles
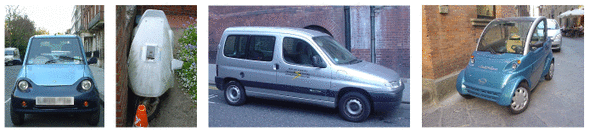
The REVA electric car was launched in June 2001 in Bangalore and is exported to the UK as the G-Wiz. The G-Wiz’s electric motor has a peak power of 13 kW, and can produce a sustained power of 4.8 kW. The motor provides regenerative braking. It is powered by eight 6-volt lead acid batteries, which when fully charged give a range of “up to 77 km.” A full charge consumes 9.7 kWh of electricity. These figures imply a transport cost of 13 kWh per 100 km.
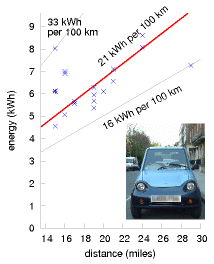
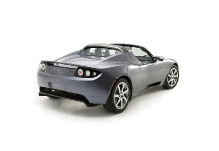
Manufacturers always quote the best possible performance of their products. What happens in real life? The real-life performance of a G-Wiz in London is shown in figure 20.21. Over the course of 19 recharges, the average transport cost of this G-Wiz is 21 kWh per 100 km – about four times better than an average fossil fuel car. The best result was 16 kWh per 100 km, and the worst was 33 kWh per 100 km. If you are interested in carbon emissions, 21 kWh per 100 km is equivalent to 105 g CO2 per km, assuming that electricity has a footprint of 500 g CO2 per kWh.Now, the G-Wiz sits at one end of the performance spectrum. What if we demand more – more acceleration, more speed, and more range? At the other end of the spectrum is the Tesla Roadster. The Tesla Roadster 2008 has a range of 220 miles (354 km); its lithium-ion battery pack stores 53 kWh and weighs 450 kg (120 Wh/kg). The vehicle weighs 1220 kg and its motor’s maximum power is 185 kW. What is the energy-consumption of this muscle car? Remarkably, it’s better than the G-Wiz: 15 kWh per 100 km. Evidence that a range of 354 km should be enough for most people most of the time comes from the fact that only 8.3% of commuters travel more than 30 km to their workplace. 15
I’ve looked up the performance figures for lots of electric vehicles – they’re listed in this chapter’s end-notes 16 – and they seem to be consistent with this summary: electric vehicles can deliver transport at an energy cost of roughly 15 kWh per 100 km. That’s five times better than our baseline fossil-car, and significantly better than any hybrid cars. Hurray! To achieve economical transport, we don’t have to huddle together in public transport – we can still hurtle around, enjoying all the pleasures and freedoms of solo travel, thanks to electric vehicles.
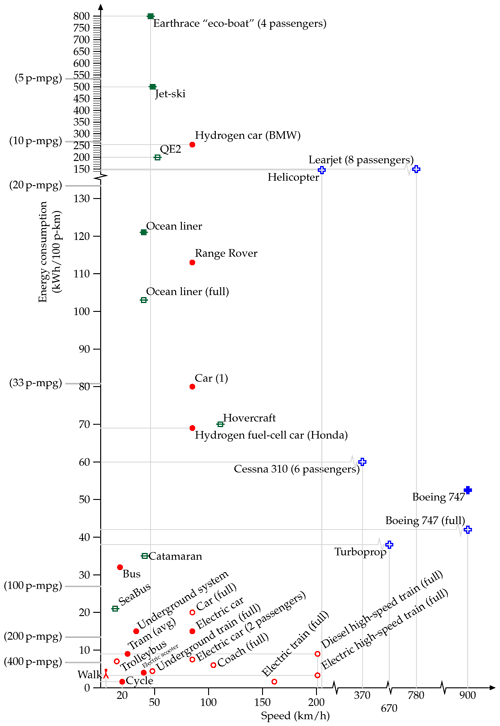Figure 20.23. Energy requirements of different forms of passenger transport. The vertical coordinate shows the energy consumption in kWh per 100 passenger-km. The horizontal coordinate indicates the speed of the transport. The "Car (1)" is an average UK car doing 33 miles per gallon with a single occupant. The "Bus" is the average performance of all London buses. The "Underground system" shows the performance of the whole London Underground system. The catamaran is a diesel-powered vessel. I’ve indicated on the left-hand side equivalent fuel efficiencies in passenger-miles per imperial gallon (p-mpg). Hollow point-styles show best-practice performance, assuming all seats of a vehicle are in use. Filled point-styles indicate actual performance of a vehicle in typical use. See also figure 15.8 (energy requirements of freight transport).This moment of celebration feels like a good time to unveil this chapter’s big summary diagram, figure 20.23, which shows the energy requirements of all the forms of passenger-transport we have discussed and a couple that are still to come.
OK, the race is over, and I’ve announced two winners – public transport, and electric vehicles. But are there any other options crossing the finishing line? We have yet to hear about the compressed-air-powered car and the hydrogen car. If either of these turns out to be better than electric car, it won’t affect the long-term picture very much: whichever of these three technologies we went for, the vehicles would be charged up using energy generated from a “green” source.

Compressed-air cars
Air-powered vehicles are not a new idea. Hundreds of trams powered by compressed air and hot water plied the streets of Nantes and Paris from 1879 to 1911. Figure 20.24 shows a German pneumatic locomotive from 1958. I think that in terms of energy efficiency the compressed-air technique for storing energy isn’t as good as electric batteries. The problem is that compressing the air generates heat that’s unlikely to be used efficiently; and expanding the air generates cold, another by-product that is unlikely to be used efficiently. But compressed air may be a superior technology to electric batteries in other ways. For example, air can be compressed thousands of times and doesn’t wear out! It’s interesting to note, however, that the first product sold by the Aircar company is actually an electric scooter. [www.theaircar.com/acf]
There’s talk of Tata Motors in India manufacturing air-cars, but it’s hard to be sure whether the compressed-air vehicle is going to see a revival, because no-one has published the specifications of any modern prototypes. Here’s the fundamental limitation: the energy-density of compressed-air energy-stores is only about 11–28 Wh per kg, 17 which is similar to lead-acid batteries, and roughly five times smaller than lithium-ion batteries. (See figure 26.13, for details of other storage technologies.) So the range of a compressed-air car will only ever be as good as the range of the earliest electric cars. Compressed-air storage systems do have three advantages over batteries: longer life, cheaper construction, and fewer nasty chemicals.
Hydrogen cars – blimp your ride
I think hydrogen is a hyped-up bandwagon. I’ll be delighted to be proved wrong, but I don’t see how hydrogen is going to help us with our energy problems. Hydrogen is not a miraculous source of energy; it’s just an energy carrier, like a rechargeable battery. And it is a rather inefficient energy carrier, with a whole bunch of practical defects.
The “hydrogen economy” received support from Nature magazine in a column praising California Governor Arnold Schwarzenegger for filling up a hydrogen-powered Hummer (figure 20.25). 18 Nature’s article lauded Arnold’s vision of hydrogen-powered cars replacing “polluting models” with the quote “the governor is a real-life climate action hero.” But the critical question that needs to be asked when such hydrogen heroism is on display is “where is the energy to come from to make the hydrogen?” Moreover, converting energy to and from hydrogen can only be done inefficiently – at least, with today’s technology.
Here are some numbers.
- In the CUTE (Clean Urban Transport for Europe) project, which was intended to demonstrate the feasibility and reliability of fuelcell buses and hydrogen technology, fuelling the hydrogen buses required between 80% and 200% more energy than the baseline diesel bus. 19
- Fuelling the Hydrogen 7, the hydrogen-powered car made by BMW, requires 254 kWh per 100 km – 220% more energy than an average European car. 20
If our task were “please stop using fossil fuels for transport, allowing yourself the assumption that infinite quantities of green electricity are available for free,” then of course an energy-profligate transport solution like hydrogen might be a contender (though hydrogen faces other problems). But green electricity is not free. Indeed, getting green electricity on the scale of our current consumption is going to be very challenging. The fossil fuel challenge is an energy challenge. The climate-change problem is an energy problem. We need to focus on solutions that use less energy, not “solutions” that use more! I know of no form of land transport whose energy consumption is worse than this hydrogen car. (The only transport methods I know that are worse are jet-skis – using about 500 kWh per 100 km – and the Earthrace biodiesel-powered speed-boat, absurdly called an eco-boat, which uses 800 kWh per 100 p-km.)

Hydrogen advocates may say “the BMW Hydrogen 7 is just an early prototype, and it’s a luxury car with lots of muscle – the technology is going to get more efficient.” Well, I hope so, because it has a lot of catching up to do. The Tesla Roadster (figure 20.22) is an early prototype too, and it’s also a luxury car with lots of muscle. And it’s more than ten times more energy-efficient than the Hydrogen 7! Feel free to put your money on the hydrogen horse if you want, and if it wins in the end, fine. But it seems daft to back the horse that’s so far behind in the race. Just look at figure 20.23 – if I hadn’t squished the top of the vertical axis, the hydrogen car would not have fitted on the page!
Yes, the Honda fuel-cell car, the FCX Clarity, does better – it rolls in at 69 kWh per 100 km – but my prediction is that after all the “zero-emissions” trumpeting is over, we’ll find that hydrogen cars use just as much energy as the average fossil car of today.
Here are some other problems with hydrogen. Hydrogen is a less convenient energy storage medium than most liquid fuels, because of its bulk, whether stored as a high pressure gas or as a liquid (which requires a temperature of -253 °C). Even at a pressure of 700 bar (which requires a hefty pressure vessel) its energy density (energy per unit volume) is 22% of gasoline’s. The cryogenic tank of the BMW Hydrogen 7 weighs 120 kg and stores 8 kg of hydrogen. Furthermore, hydrogen gradually leaks out of any practical container. If you park your hydrogen car at the railway station with a full tank and come back a week later, you should expect to find most of the hydrogen has gone.
Some questions about electric vehicles
You’ve shown that electric cars are more energy-efficient than fossil cars. But are they better if our objective is to reduce CO2 emissions, and the electricity is still generated by fossil power stations?
This is quite an easy calculation to do. Assume the electric vehicle’s energy cost is 20 kWh(e) per 100 km. (I think 15 kWh(e) per 100 km is perfectly possible, but let’s play sceptical in this calculation.) If grid electricity has a carbon footprint of 500 g per kWh(e) then the effective emissions of this vehicle are 100 g CO2 per km, which is as good as the best fossil cars (figure 20.9). So I conclude that switching to electric cars is already a good idea, even before we green our electricity supply.
Electric cars, like fossil cars, have costs of both manufacture and use. Electric cars may cost less to use, but if the batteries don’t last very long, shouldn’t you pay more attention to the manufacturing cost?
Yes, that’s a good point. My transport diagram shows only the use cost. If electric cars require new batteries every few years, my numbers may be underestimates. The batteries in a Prius are expected to last just 10 years, and a new set would cost £3500. Will anyone want to own a 10-year old Prius and pay that cost? It could be predicted that most Priuses will be junked at age 10 years. This is certainly a concern for all electric vehicles that have batteries. I guess I’m optimistic that, as we switch to electric vehicles, battery technology is going to improve.
I live in a hot place. How could I drive an electric car? I demand power-hungry air-conditioning!
There’s an elegant fix for this demand: fit 4 m2 of photovoltaic panels in the upward-facing surfaces of the electric car. If the air-conditioning is needed, the sun must surely be shining. 20%-efficient panels will generate up to 800 W, which is enough to power a car’s air-conditioning. The panels might even make a useful contribution to charging the car when it’s parked, too. Solar-powered vehicle cooling was included in a Mazda in 1993; the solar cells were embedded in the glass sunroof.
I live in a cold place. How could I drive an electric car? I demand power-hungry heating!
The motor of an electric vehicle, when it’s running, will on average use something like 10 kW, with an efficiency of 90–95%. Some of the lost power, the other 5–10%, will be dissipated as heat in the motor. Perhaps electric cars that are going to be used in cold places can be carefully designed so that this motor-generated heat, which might amount to 250 or 500 W, can be piped from the motor into the car. That much power would provide some significant windscreen demisting or body-warming.
Are lithium-ion batteries safe in an accident?
Some lithium-ion batteries are unsafe when short-circuited or overheated, but the battery industry is now producing safer batteries such as lithium phosphate. There’s a fun safety video at www.valence.com.
Is there enough lithium to make all the batteries for a huge fleet of electric cars?
World lithium reserves are estimated to be 9.5 million tons in ore deposits (chapter 24). A lithium-ion battery is 3% lithium. 21 If we assume each vehicle has a 200 kg battery, then we need 6 kg of lithium per vehicle. So the estimated reserves in ore deposits are enough to make the batteries for 1.6 billion vehicles. That’s more than the number of cars in the world today (roughly 1 billion) – but not much more, so the amount of lithium may be a concern, especially when we take into account the competing ambitions of the nuclear fusion posse (Chapter 24) to guzzle lithium in their reactors. There’s many thousands times more lithium in sea water, so perhaps the oceans will provide a useful backup. However, lithium specialist R. Keith Evans says 22 “concerns regarding lithium availability for hybrid or electric vehicle batteries or other foreseeable applications are unfounded.” And anyway, other lithium-free battery technologies such as zinc-air rechargeables are being developed [www.revolttechnology.com]. I think the electric car is a goer!

The future of flying?
The superjumbo A380 is said by Airbus to be “a highly fuel-efficient aircraft.” In fact, it burns just 12% less fuel per passenger than a 747.
Boeing has announced similar breakthroughs: their new 747–8 Intercontinental, trumpeted for its planet-saving properties, is (according to Boeing’s advertisements) only 15% more fuel-efficient than a 747–400.
This slender rate of progress (contrasted with cars, where changes in technology deliver two-fold or even ten-fold improvements in efficiency) is explained in Technical Chapter C. Planes are up against a fundamental limit imposed by the laws of physics. Any plane, whatever its size, has to expend an energy of about 0.4 kWh per ton-km on keeping up and keeping moving. Planes have already been fantastically optimized, and there is no prospect of significant improvements in plane efficiency.

For a time, I thought that the way to solve the long-distance-transport problem was to revert to the way it was done before planes: ocean liners. Then I looked at the numbers. The sad truth is that ocean liners use more energy per passenger-km than jumbo jets. The QE2 uses four times as much energy per passenger-km as a jumbo. OK, it’s a luxury vessel; can we do better with slower tourist-class liners? From 1952 to 1968, the economical way to cross the Atlantic was in two Dutch-built liners known as “The Economy Twins,” the Maasdam and the Rijndam. 23 These travelled at 16.5 knots (30.5 km/h), so the crossing from Britain to New York took eight days. Their energy consumption, if they carried a full load of 893 passengers, was 103 kWh per 100 p-km. At a typical 85% occupancy, the energy consumption was 121 kWh per 100 pkm – more than twice that of the jumbo jet. To be fair to the boats, they are not only providing transportation: they also provide the passengers and crew with hot air, hot water, light, and entertainment for several days; but the energy saved back home from being cooped up on the boat is dwarfed by the boat’s energy consumption, which, in the case of the QE2, is about 3000 kWh per day per passenger.
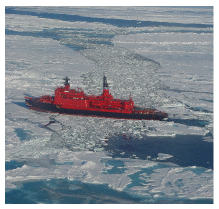
So, sadly, I don’t think boats are going to beat planes in energy consumption. If eventually we want a way of travelling large distances without fossil fuels, perhaps nuclear-powered ships are an interesting option (figures 20.31 & 20.32).
What about freight?
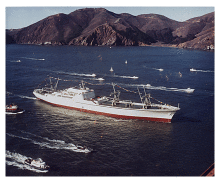
International shipping is a surprisingly efficient user of fossil fuels; so getting road transport off fossil fuels is a higher priority than getting ships off fossil fuels. But fossil fuels are a finite resource, and eventually ships must be powered by something else. Biofuels may work out. Another option will be nuclear power. The first nuclear-powered ship for carrying cargo and passengers was the NS Savannah, launched in 1962 as part of President Dwight D. Eisenhower’s Atoms for Peace initiative (figure 20.31). Powered by one 74-MW nuclear reactor driving a 15-MW motor, the Savannah had a service speed of 21 knots (39 km/h) and could carry 60 passengers and 14000 t of cargo. That’s a cargo transport cost of 0.14 kWh per ton-km. She could travel 500 000 km without refuelling. There are already many nuclear-powered ships, both military and civilian. Russia has ten nuclear-powered ice-breakers, for example, of which seven are still active. Figure 20.32 shows the nuclear ice-breaker Yamal, which has two 171-MW reactors, and motors that can deliver 55 MW.
“Hang on! You haven’t mentioned magnetic levitation”
The German company, Transrapid, which made the maglev train for Shanghai, China (figure 20.33), says: “The Transrapid Superspeed Maglev System is unrivaled when it comes to noise emission, energy consumption, and land use. The innovative non-contact transportation system provides mobility without the environment falling by the wayside.” 24
Magnetic levitation is one of many technologies that gets hyped up when people are discussing energy issues. In energy-consumption terms, the comparison with other fast trains is actually not as flattering as the hype suggests. The Transrapid site compares the Transrapid with the InterCityExpress (ICE), a high-speed electric train.
Fast trains compared at 200 km/h (125mph)
Transrapid
2.2 kWh per 100 seat-km
ICE
2.9 kWh per 100 seat-km

The main reasons why maglev is slightly better than the ICE are: the magnetic propulsion motor has high efficiency; the train itself has low mass, because most of the propulsion system is in the track, rather than the train; and more passengers are inside the train because space is not needed for motors. Oh, and perhaps because the data are from the maglev company’s website, so are bound to make the maglev look better!
Incidentally, people who have seen the Transrapid train in Shanghai tell me that at full speed it is “about as quiet as a jet aircraft.”
Notes and further reading
www.tfl.gov.uk/assets/downloads/corporate/TfL-environment-report2007.pdf,
www.tfl.gov.uk/assets/downloads/corporate/London-TravelReport-2007-final.pdf,
Th!nk Electric cars from Norway. The five-door Th!nk Ox has a range of 200km. Its batteries weigh 350 kg, and the car weighs 1500 kg in total. Its energy consumption is approximately 20 kWh per 100 km. www.think.no
Electric Smart Car “The electric version is powered by a 40 bhp motor, can go up to 70 miles, and has a top speed of 70 mph. Recharging is done through a standard electrical power point and costs about £1.20, producing the equivalent of 60 g/km of carbon dioxide emissions at the power station. [cf. the equivalent petrol-powered Smart: 116 g/km.] A full recharge takes about eight hours, but the battery can be topped up from 80%-drained to 80%-charged in about three-and-a-half hours.” [www.whatcar.com/newsarticle.aspx?NA=226488]

Berlingo Electrique 500E, an urban delivery van (figure 20.20), has 27 nicad batteries and a 28 kW motor. It can transport a payload of 500 kg. Top speed: 100 km/h; range: 100 km. 25 kWh per 100 km.(Estimate kindly supplied by a Berlingo owner.) [4wm2w4]
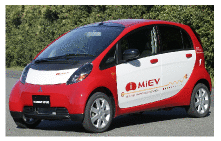
i MiEV This electric car is projected to have a range of 160 km with a 16 kWh battery pack. That’s 10 kWh per 100 km – better than the G-Wiz – and whereas it’s hard to fit two adult Europeans in a G-Wiz, the Mitsubishi prototype has four doors and four full-size seats (figure 20.38). [658ode]
EV1 The two-seater General Motors EV1 had a range of 120 to 240 km per charge, with nickel-metal hydride batteries holding 26.4 kWh. That’s an energy consumption of between 11 and 22 kWh per 100 km.
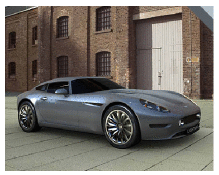
Lightning (figure 20.39) – has four 120 kW brushless motors, one on each wheel, regenerative braking, and fast-charging Nanosafe lithium titanate batteries. A capacity of 36 kWh gives a range of 200 miles (320 km). That’s 11 kWh per 100 km. www.lightningcarcompany.co.uk
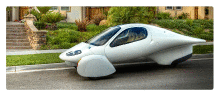
Aptera This fantastic slippery fish is a two-seater vehicle, said to have an energy cost of 6 kWh per 100 km. It has a drag coefficient of 0.11 (figure 20.40). Electric and hybrid models are being developed. www.aptera.com
Loremo Like the Aptera, the Loremo (figure 20.41) has a small frontal area and small drag coefficient (0.2) and it’s going to be available in both fossil-fuel and electric versions. It has two adult seats and two rear-facing kiddie seats. The Loremo EV will have lithium ion batteries and is predicted to have an energy cost of 6 kWh per 100 km, a top speed of 170 km/h, and a range of 153 km. It weighs 600 kg. evolution.loremo.com
eBox The eBox has a lithium-ion battery with a capacity of 35 kWh and a weight of 280 kg; and a range of 140–180 miles. Its motor has a peak power of 120 kW and can produce a sustained power of 50 kW. Energy consumption: 12 kWh per 100 km.
Ze-0 A five-seat, five-door car. Maximum speed: 50mph. Range: 50 miles. Weight, including batteries: 1350 kg. Lead acid batteries with capacity of 18 kWh. Motor: 15 kW. 22.4 kWh per 100 km.
e500 An Italian Fiat-like car, with two doors and 4 seats. Maximum speed: 60 mph. Range in city driving: 75 miles. Battery: lithium-ion polymer.
MyCar The MyCar is an Italian-designed two-seater. Maximum speed: 40 mph. Maximum range: 60 miles. Lead-acid battery.
Mega City A two-seater car with a maximum continuous power of 4 kW and maximum speed of 40 mph: 11.5 kWh per 100 km. Weight unladen (including batteries) – 725 kg. The lead batteries have a capacity of 10 kWh.
Xebra Is claimed to have a 40 km range from a 4.75 kWh charge. 12 kWh per 100 km. Maximum speed 65 km/h. Lead-acid batteries.
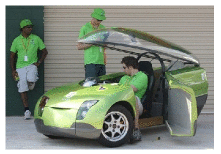
Figure 20.42. The TREV. 6 kWh per 100 km. Photo from www.unisa.edu.au.
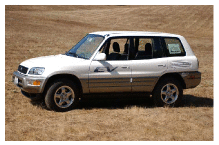
Figure 20.43. Toyota RAV4 EV. Photo by Kenneth Adelman.
TREV The Two-Seater Renewable Energy Vehicle (TREV) is a prototype developed by the University of South Australia (figure 20.42). This three-wheeler has a range of 150 km, a top speed of 120 km/h, a mass of 300 kg, and lithium-ion polymer batteries weighing 45 kg. During a real 3000 km trip, the energy consumption was 6.2 kWh per 100 km. w3.unisa.edu.au/solarcar/trev/
Venturi Fetish Has a 28 kWh battery, weighing 248 kg. The car weighs 1000 kg. Range 160–250 km. That’s 11–17 kWh per 100 km. www.venturifetish.fr/fetish.html
Toyota RAV4 EV This vehicle – an all-electric mini-SUV – was sold by Toyota between 1997 and 2003 (figure 20.43). The RAV4 EV has 24 12-volt 95 Ah NiMH batteries capable of storing 27.4 kWh of energy; and a range of 130 to 190 km. So that’s an energy consumption of 14–21 kWh per 100 km. The RAV4 EV was popular with Jersey Police force.
Phoenix SUT – a five-seat “sport utility truck” made in California – has a range of “up to 130 miles” from a 35 kWh lithium-ion battery pack. (That’s 17 kWh per 100 km.) The batteries can be recharged from a special outlet in 10 minutes. www.gizmag.com/go/7446/
Modec delivery vehicle Modec carries two tons a distance of 100 miles. Kerb weight 3000 kg. www.modec.co.uk
Smith Ampere Smaller delivery van, 24 kWh lithium ion batteries. Range “over 100 miles.” www.smithelectricvehicles.com
Electric minibus From www.smithelectricvehicles.com: 40 kWh lithium ion battery pack. 90 kW motor with regenerative brakes. Range “up to 100 miles.” 15 seats. Vehicle kerb weight 3026 kg. Payload 1224 kg. That’s a vehicle-performance of at best 25 kWh per 100 km. If the vehicle is fully occupied, it could deliver transportation at an impressive cost of 2 kWh per 100 p-km.
Electric coach The Thunder Sky bus has a range of 180 miles and a recharge time of three hours. www.thunder-sky.com
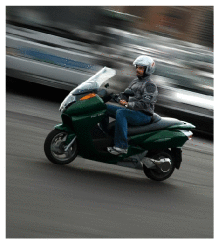
Figure 20.44. Vectrix: 2.75 kWh per 100 km. Photo from www.vectrix.com.
Electric scooters The Vectrix is a substantial scooter (figure 20.44). Its battery (nickel metal hydride) has a capacity of 3.7 kWh. It can be driven for up to 68 miles at 25 miles/h (40 km/h), on a two-hour charge from a standard electrical socket. That’s 110 km for 3 kWh, or 2.75 kWh per 100 km. It has a maximum speed of 62 mph (100 km/h). It weighs 210 kg and has a peak power of 20 kW. www.vectrix.com The “Oxygen Cargo” is a smaller scooter. It weighs 121 kg, has a 38 mile range, and takes 2–3 hours to charge. Peak power: 3.5 kW; maximum speed 28 mph. It has two lithium-ion batteries and regenerative brakes. The range can be extended by adding extra batteries, which store about 1.2 kWh and weigh 15 kg each. Energy consumption: 4 kWh per 100 km.
Hydrogen and fuel cells are not the way to go. The decision by the Bush administration and the State of California to follow the hydrogen highway is the single worst decision of the past few years.
James Woolsey, Chairman of the Advisory Board of the US Clean Fuels Foundation, 27th November 2007.
In September 2008, The Economist wrote “Almost nobody disputes that … eventually most cars will be powered by batteries alone.” On the other hand, to hear more from advocates of hydrogen-based transport, see the Rocky Mountain Institute’s pages about the “HyperCar” www.rmi.org/hypercar/.
The Hydrogen 7 and its hydrogen-fuel-cell cousins are, in many ways, simply flashy distractions.
David Talbot, MIT Technology Review www.technologyreview.com/Energy/18301/
Honda’s fuel-cell car, the FCX Clarity, weighs 1625 kg, stores 4.1 kg of hydrogen at a pressure of 345 bar, and is said to have a range of 280 miles, consuming 57 miles of road per kg of hydrogen (91 km per kg) in a standard mix of driving conditions [czjjo], [5a3ryx]. Using the cost for creating hydrogen mentioned above, assuming natural gas is used as the main energy source, this car has a transport cost of 69 kWh per 100 km.
Honda might be able to kid journalists into thinking that hydrogen cars are “zero emission” but unfortunately they can’t fool the climate.
Merrick Godhaven
- A widely quoted statistic says “Only 1% of fuel energy in a car goes into moving the driver.” In fact the percentage in this myth varies in size as it commutes around the urban community. Some people say “5% of the energy goes into moving the driver.” Others say “A mere three tenths of 1 percent of fuel energy goes into moving the driver.” [4qgg8q] My take, by the way, is that none of these statistics is correct or helpful.↩
- The bicycle’s performance is about the same as the eco-car’s. Cycling on a single-person bike costs about 1.6 kWh per 100 km, assuming a speed of 20 km/h. For details and references, see Chapter A.↩
- London Underground. A Victoria-line train consists of four 30.5-ton and four 20.5-ton cars (the former carrying the motors). Laden, an average train weighs 228 tons. The maximum speed is 45 mile/h. The average speed is 31 mph. A train with most seats occupied carries about 350 passengers; crush-loaded, the train takes about 620. The energy consumption at peak times is about 4.4 kWh per 100 passenger-km (Catling, 1966).↩
- High-speed train. A diesel-powered intercity 125 train (on the right in figure 20.5) weighs 410 tons. When travelling at 125mph, the power delivered “at the rail” is 2.6 MW. The number of passengers in a full train is about 500. The average fuel consumption is about 0.84 litres of diesel per 100 seat-km [5o5x5m], which is a transport cost of about 9 kWh per 100 seat-km. The Class 91 electric train (on the left in figure 20.5) travels at 140 mph (225 km/h) and uses 4.5 MW. According to Roger Kemp, this train’s average energy consumption is 3 kWh per 100 seat-km [5o5x5m]. The government document [5fbeg9] says that east-coast mainline and west-coast mainline trains both consume about 15 kWh per km (whole train). The number of seats in each train is 526 or 470 respectively. So that’s 2.9–3.2 kWh per 100 seat-km.↩
- the total energy cost of all London’s underground trains, was 15 kWh per 100 p-km. … The energy cost of all London buses was 32 kWh per 100 pkm. Source: [679rpc]. Source for train speeds and bus speeds: Ridley and Catling (1982).↩
- Croydon Tramlink.↩
- … provision of excellent cycle facilities … The UK street design guide [www.manualforstreets.org.uk] encourages designing streets to make 20 miles per hour the natural speed. See also Franklin (2007).↩
- A fair and simple method for handling congestion-charging. I learnt a brilliant way to automate congestion-charging from Stephen Salter. A simple daily congestion charge, as levied in London, sends only a crude signal to drivers; once a car-owner has decided to pay the day’s charge and drive into a congestion zone, he has no incentive to drive little in the zone. Nor is he rewarded with any rebate if he carefully chooses routes in the zone that are not congested. Instead of having a centralized authority that decides in advance when and where the congestion-charge zones are, with expensive and intrusive monitoring and recording of vehicle movements into and within all those zones, Salter has a simpler, decentralized, anonymous method of charging drivers for driving in heavy, slow traffic, wherever and whenever it actually exists. The system would operate nationwide. Here’s how it works. We want a device that answers the question “how congested is the traffic I am driving in?” A good measure of congestion is “how many other active vehicles are close to mine?” In fast-moving traffic, the spacing between vehicles is larger than slow-moving traffic. Traffic that’s trundling in tedious queues is the most densely packed. The number of nearby vehicles that are active can be sensed anonymously by fitting in every vehicle a radio transmitter/receiver (like a very cheap mobile phone) that transmits little radio-bleeps at a steady rate whenever the engine is running, and that counts the number of bleeps it hears from other vehicles. The congestion charge would be proportional to the number of bleeps received; this charge could be paid at refuelling stations whenever the vehicle is refuelled. The radio transmitter/receiver would replace the current UK road tax disc.↩
- hydraulics and flywheels salvage at least 70% of the braking energy. Compressed air is used for regenerative braking in trucks; eaton.com say “hydraulic launch assist” captures 70% of the kinetic energy. [5cp27j] The flywheel system of flybridsystems.com also captures 70% of the kinetic energy. www.flybridsystems.com/F1System.html Electric regenerative braking salvages 50%. Source: E4tech (2007).↩
- Electric batteries capable of delivering 60 kW would weigh about 200 kg. Good lithium-ion batteries have a specific power of 300 W/kg (Horie et al., 1997; Mindl, 2003).↩
- the average new car in the UK emits 168 g CO2 per km. This is the figure for the year 2006 (King, 2008). The average emissions of a new passenger vehicle in the USA were 255 g per km (King, 2008).↩
- The Toyota Prius has a more-efficient engine. The Prius’s petrol engine uses the Atkinson cycle, in contrast to the conventional Otto cycle. By cunningly mixing electric power and petrol power as the driver’s demands change, the Prius gets by with a smaller engine than is normal in a car of its weight, and converts petrol to work more efficiently than a conventional petrol engine.↩
- Hybrid technologies give fuel savings of 20% or 30%. For example, from Hitachi’s research report describing hybrid trains (Kaneko et al., 2004): highefficiency power generation and regenerative braking are “expected to give fuel savings of approximately 20% compared with conventional diesel-powered trains.”↩
- Only 8.3% of commuters travel over 30 km to their workplace. Source: Eddington (2006). The dependence of the range of an electric car on the size of its battery is discussed in Chapter A.↩
- Lots of electric vehicles. They are all listed below, in no particular order. Performance figures are mainly from the manufacturers. As we saw above, real-life performance doesn’t always match manufacturers’ claims.↩
- the energy-density of compressed-air energy-stores is only about 11–28Wh per kg. The theoretical limit, assuming perfect isothermal compression: if 1 m3 of ambient air is slowly compressed into a 5-litre container at 200 bar, the potential energy stored is 0.16 kWh in 1.2 kg of air. In practice, a 5-litre container appropriate for this sort of pressure weighs about 7.5 kg if made from steel or 2 kg using kevlar or carbon fibre, and the overall energy density achieved would be about 11–28 Wh per kg. The theoretical energy density is the same, whatever the volume of the container.↩
- Arnold Schwarzenegger … filling up a hydrogen-powered Hummer. Nature 438, 24 November 2005. I’m not saying that hydrogen will never be useful for transportation; but I would hope that such a distinguished journal as Nature would address the hydrogen bandwagon with some critical thought, not only euphoria.↩
- In the Clean Urban Transport for Europe project the overall energy required to power the hydrogen buses was between 80% and 200% greater than that of the baseline diesel bus. Source: CUTE (2006); Binder et al. (2006).↩
- Fuelling the hydrogen-powered car made by BMW requires three times more energy than an average car. Half of the boot of the BMW “Hydrogen 7” car is taken up by its 170-litre hydrogen tank, which holds 8 kg of hydrogen, giving a range of 200 km on hydrogen [news.bbc.co.uk/1/hi/business/6154212.stm]. The calorific value of hydrogen is 39 kWh per kg, and the best-practice energy cost of making hydrogen is 63 kWh per kg (made up of 52 kWh of natural gas and 11 kWh of electricity) (CUTE, 2006). So filling up the 8 kg tank has an energy cost of at least 508 kWh; and if that tank indeed delivers 200 km, then the energy cost is 254 kWh per 100 km.↩
- A lithium-ion battery is 3% lithium. Source: Fisher et al. (2006).↩
- Lithium specialist R. Keith Evans says “concerns regarding lithium availability … are unfounded.” – Evans (2008).↩
- Two Dutch-built liners known as “The Economy Twins.” www.ssmaritime.com/rijndam-maasdam.htm. QE2: www.qe2.org.uk.↩
- Transrapid magnetic levitation train. www.transrapid.de.↩