
24 Nuclear?
We made the mistake of lumping nuclear energy in with nuclear weapons, as if all things nuclear were evil. I think that’s as big a mistake as if you lumped nuclear medicine in with nuclear weapons.
Patrick Moore, former Director of Greenpeace International
Nuclear power comes in two flavours. Nuclear fission is the flavour that we know how to use in power stations; fission uses uranium, an exceptionally heavy element, as fuel. Nuclear fusion is the flavour that we don’t yet know how to implement in power stations; fusion would use light elements, especially hydrogen, as its fuel. Fission reactions split up heavy nuclei into medium-sized nuclei, releasing energy. Fusion reactions fuse light nuclei into medium-sized nuclei, releasing energy.
Both forms of nuclear power, fission and fusion, have an important property: the nuclear energy available per atom is roughly one million times bigger than the chemical energy per atom of typical fuels. This means that the amounts of fuel and waste that must be dealt with at a nuclear reactor can be up to one million times smaller than the amounts of fuel and waste at an equivalent fossil-fuel power station.
Let’s try to personalize these ideas. The mass of the fossil fuels consumed by “the average British person” is about 16 kg per day (4 kg of coal, 4 kg of oil, and 8 kg of gas). That means that every single day, an amount of fossil fuels with the same weight as 28 pints of milk is extracted from a hole in the ground, transported, processed, and burned somewhere on your behalf. The average Brit’s fossil fuel habit creates 11 tons per year of waste carbon dioxide; that’s 30 kg per day. In the previous chapter we raised the idea of capturing waste carbon dioxide, compressing it into solid or liquid form, and transporting it somewhere for disposal. Imagine that one person was responsible for capturing and dealing with all their own carbon dioxide waste. 30 kg per day of carbon dioxide is a substantial rucksack-full every day – the same weight as 53 pints of milk!
In contrast, the amount of natural uranium required to provide the same amount of energy as 16 kg of fossil fuels, in a standard fission reactor, is 2 grams; and the resulting waste weighs one quarter of a gram. (This 2 g of uranium is not as small as one millionth of 16 kg per day, by the way, because today’s reactors burn up less than 1% of the uranium.) To deliver 2 grams of uranium per day, the miners at the uranium mine would have to deal with perhaps 200 g of ore per day.
So the material streams flowing into and out of nuclear reactors are small, relative to fossil-fuel streams. “Small is beautiful,” but the fact that the nuclear waste stream is small doesn’t mean that it’s not a problem; it’s just a “beautifully small” problem.
“Sustainable” power from nuclear fission
Figure 24.1 shows how much electricity was generated globally by nuclear power in 2007, broken down by country.
million tons uranium
Australia
1.14
Kazakhstan
0.82
Canada
0.44
USA
0.34
South Africa
0.34
Namibia
0.28
Brazil
0.28
Russian Federation
0.17
Uzbekistan
0.12
World total (conventional reserves in the ground)
4.7
Phosphate deposits
22
Seawater
4500
Table 24.2. Known recoverable resources of uranium. The top part of the table shows the "reasonable assured resources" and "inferred resources," at cost less than $130 per kg of uranium, as of 1 Jan 2005. These are the estimated resources in areas where exploration has taken place. There’s also 1.3 million tons of depleted uranium sitting around in stockpiles, a by-product of previous uranium activities.
Could nuclear power be “sustainable”? Leaving aside for a moment the usual questions about safety and waste-disposal, a key question is whether humanity could live for generations on fission. How great are the world wide supplies of uranium, and other fissionable fuels? Do we have only a few decades’ worth of uranium, or do we have enough for millennia?
To estimate a “sustainable” power from uranium, I took the total recoverable uranium in the ground and in seawater, divided it fairly between 6 billion humans, and asked “how fast can we use this if it has to last 1000 years?”
Almost all the recoverable uranium is in the oceans, not in the ground: seawater contains 3.3 mg of uranium per m3 of water, which adds up to 4.5 billion tons worldwide. I called the uranium in the ocean “recoverable” but this is a bit inaccurate – most ocean waters are quite inaccessible, and the ocean conveyor belt rolls round only once every 1000 years or so; and no-one has yet demonstrated uranium-extraction from seawater on an in dustrial scale. So we’ll make separate estimates for two cases: first using only mined uranium, and second using ocean uranium too.
The uranium ore in the ground that’s extractable at prices below $130 per kg of uranium is about one thousandth of this. If prices went above $130 per kg, phosphate deposits that contain uranium at low concentrations would become economic to mine. Recovery of uranium from phosphates is perfectly possible, and was done in America and Belgium before 1998. For the estimate of mined uranium, I’ll add both the conventional uranium ore and the phosphates, to give a total resource of 27 million tons of uranium (table 24.2).
We’ll consider two ways to use uranium in a reactor: (a) the widely-used once-through method gets energy mainly from the 235U (which makes up just 0.7% of uranium), and discards the remaining 238U; (b) fast breeder reactors, which are more expensive to build, convert the 238U to fissionable plutonium-239 and obtain roughly 60 times as much energy from the uranium. 2
Once-through reactors, using uranium from the ground
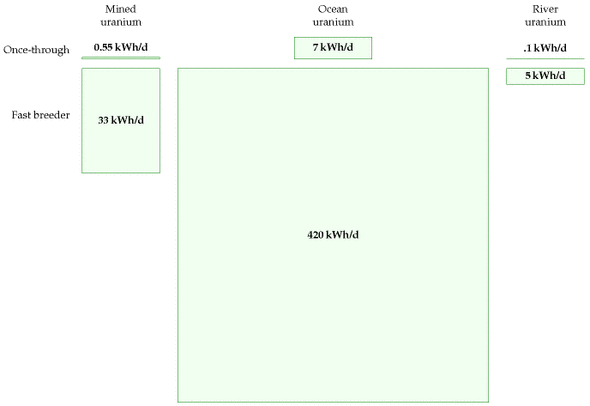
A once-through one-gigawatt nuclear power station uses 162 tons per year of uranium. 3 So the known mineable resources of uranium, shared between 6 billion people, would last for 1000 years if we produced nuclear power at a rate of 0.55 kWh per day per person. This sustainable rate is the output of just 136 nuclear power stations, and is half of today’s nuclear power production. It’s very possible this is an underestimate of uranium’s potential, since, as there is not yet a uranium shortage, there is no incentive for exploration and little uranium exploration has been undertaken since the 1980s; so maybe more mineable uranium will be discovered. Indeed, one paper published in 1980 estimated that the low-grade uranium resource is more than 1000 times greater than the 27 million tons we just assumed. 4
Could our current once-through use of mined uranium be sustainable? It’s hard to say, since there is such uncertainty about the result of future exploration. Certainly at today’s rate of consumption, once-through reactors could keep going for hundreds of years. But if we wanted to crank up nuclear power 40-fold worldwide, in order to get off fossil fuels and to allow standards of living to rise, we might worry that once-through reactors are not a sustainable technology.
Fast breeder reactors, using uranium from the ground
Uranium can be used 60 times more efficiently in fast breeder reactors, which burn up all the uranium – both the 238U and the 235U (in contrast to the once-through reactors, which burn mainly 235U). As long as we don’t chuck away the spent fuel that is spat out by once-through reactors, this source of depleted uranium could be used too, so uranium that is put in once-through reactors need not be wasted. If we used all the mineable uranium (plus the depleted uranium stockpiles) in 60-times-more-efficient fast breeder reactors, the power would be 33 kWh per day per person. Attitudes to fast breeder reactors range from “this is a dangerous failed experimental technology whereof one should not speak” to “we can and should start building breeder reactors right away.” I am not competent to comment on the risks of breeder technology, and I don’t want to mix ethical assertions with factual assertions. My aim is just to help understand the numbers. The one ethical position I wish to push is “we should have a plan that adds up.”
Once-through, using uranium from the oceans
The oceans’ uranium, if completely extracted and used in once-through reactors, corresponds to a total energy of
[\begin{matrix} \frac{\text{4.5\ billion\ tons\ per\ planet}}{\text{162\ tons\ uranium\ per\ GW-year}} \ {\text{\quad\quad\quad} = \text{~28\ million\ GW-years\ per\ planet.}} \ \end{matrix}]
How fast could uranium be extracted from the oceans? The oceans circulate slowly: half of the water is in the Pacific Ocean, and deep Pacific waters circulate to the surface on the great ocean conveyor only every 1600 years. Let’s imagine that 10% of the uranium is extracted over such a 1600-year period. That’s an extraction rate of 280 000 tons per year. In once-through reactors, this would deliver power at a rate of
2.8 million GW-years / 1600 years = 1750 GW,
which, shared between 6 billion people, is 7 kWh per day per person. (There’s currently 369 GW of nuclear reactors, so this figure corresponds to a 4-fold increase in nuclear power over today’s levels.) I conclude that ocean extraction of uranium would turn today’s once-through reactors into a “sustainable” option – assuming that the uranium reactors can cover the energy cost of the ocean extraction process.
Fast breeder reactors, using uranium from the oceans
If fast reactors are 60 times more efficient, the same extraction of ocean uranium could deliver 420 kWh per day per person. At last, a sustainable figure that beats current consumption! – but only with the joint help of two technologies that are respectively scarcely-developed and unfashionable: ocean extraction of uranium, and fast breeder reactors.
Using uranium from rivers
The uranium in the oceans is being topped up by rivers, which deliver uranium at a rate of 32 000 tons per year. If 10% of this influx were captured, it would provide enough fuel for 20 GW of once-through reactors, or 1200 GW of fast breeder reactors. The fast breeder reactors would deliver 5 kWh per day per person.
All these numbers are summarized in figure 24.6.
What about costs?
As usual in this book, my main calculations have paid little attention to economics. However, since the potential contribution of ocean-uranium-based power is one of the biggest in our “sustainable” production list, it seems appropriate to discuss whether this uranium-power figure is at all economically plausible.
Japanese researchers have found a technique for extracting uranium from seawater 5 at a cost of $100–300 per kilogram of uranium, in comparison with a current cost of about $20/kg for uranium from ore. Because uranium contains so much more energy per ton than traditional fuels, this 5-fold or 15-fold increase in the cost of uranium would have little effect on the cost of nuclear power: nuclear power’s price is dominated by the cost of power-station construction and decommissioning, not by the cost of the fuel. Even a price of $300/kg would increase the cost of nuclear energy by only about 0.3 p per kWh. The expense of uranium extraction could be reduced by combining it with another use of seawater – for example, power-station cooling. 6
We’re not home yet: does the Japanese technique scale up? What is the energy cost of processing all the seawater? In the Japanese experiment, three cages full of adsorbent uranium-attracting material weighing 350 kg collected “more than 1 kg of yellow cake in 240 days;” this figure corresponds to about 1.6 kg per year. The cages had a cross-sectional area of 48 m2. To power a once-through 1 GW nuclear power station, we need 160 000 kg per year, which is a production rate 100 000 times greater than the Japanese experiment’s. If we simply scaled up the Japanese technique, which accumulated uranium passively from the sea, a power of 1 GW would thus need cages having a collecting area of 4.8 km2 and containing a weight of 350 000 tons of adsorbent material – more than the weight of the steel in the reactor itself. To put these large numbers in human terms, if uranium were delivering, say, 22 kWh per day per person, each 1 GW reactor would be shared between 1 million people, each of whom needs 0.16 kg of uranium per year. So each person would require one tenth of the Japanese experimental facility, with a weight of 35 kg per person, and an area of 5 m2 per person. The proposal that such uranium-extraction facilities should be created is thus similar in scale to proposals such as “every person should have 10 m2 of solar panels” and “every person should have a one-ton car and a dedicated parking place for it.” A large investment, yes, but not absurdly off scale. And that was the calculation for once-through reactors. For fast breeder reactors, 60 times less uranium is required, so the mass per person of the uranium collector would be 0.5 kg.
Thorium
| Country | Reserves (1000 tons) |
|---|---|
| Turkey | 380 |
| Australia | 300 |
| India | 290 |
| Norway | 170 |
| USA | 160 |
| Canada | 100 |
| South Africa | 35 |
| Brazil | 16 |
| Other countries | 95 |
| World total | 1580 |
Thorium is a radioactive element similar to uranium. Formerly used to make gas mantles, it is about three times as abundant in the earth’s crust as uranium. Soil commonly contains around 6 parts per million of thorium, and some minerals contain 12% thorium oxide. Seawater contains little thorium, because thorium oxide is insoluble. Thorium can be completely burned up in simple reactors (in contrast to standard uranium reactors which use only about 1% of natural uranium). Thorium is used in nuclear reactors in India. If uranium ore runs low, thorium will probably become the dominant nuclear fuel.
Thorium reactors deliver 3.6 billion kWh of heat per ton of thorium, 8 which implies that a 1 GW reactor requires about 6 tons of thorium per year, assuming its generators are 40% efficient. Worldwide thorium resources are estimated to total about 6 million tons, four times more than the known reserves shown in table 24.7. As with the uranium resources, it seems plausible that these thorium resources are an underestimate, since thorium prospecting is not highly valued today. If we assume, as with uranium, that these resources are used up over 1000 years and shared equally among 6 billion people, we find that the “sustainable” power thus generated is 4 kWh/d per person.
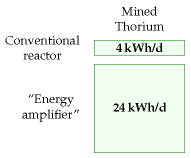
An alternative nuclear reactor for thorium, the “energy amplifier” or “accelerator-driven system” proposed by Nobel laureate Carlo Rubbia and his colleagues 9 would, they estimated, convert 6 million tons of thorium to 15 000 TWy of energy, or 60 kWh/d per person over 1000 years. Assuming conversion to electricity at 40% efficiency, this would deliver 24 kWh/d per person for 1000 years. And the waste from the energy amplifier would be much less radioactive too. They argue that, in due course, many times more thorium would be economically extractable than the current 6 million tons. If their suggestion – 300 times more – is correct, then thorium and the energy amplifier could offer 120 kWh/d per person for 60 000 years.
Land use
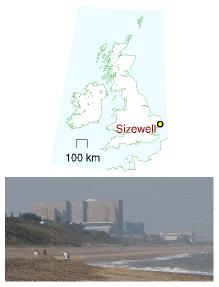
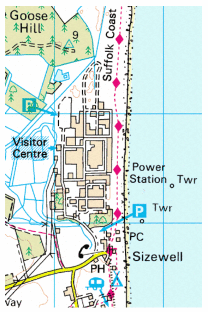
Let’s imagine that Britain decides it is serious about getting off fossil fuels, and creates a lot of new nuclear reactors, even though this may not be “sustainable.” If we build enough reactors to make possible a significant decarbonization of transport and heating, can we fit the required nuclear reactors into Britain? The number we need to know is the power per unit area of nuclear power stations, which is about 1000W/m2 (figure 24.10). Let’s imagine generating 22 kWh per day per person of nuclear power – equivalent to 55 GW (roughly the same as France’s nuclear power), which could be delivered by 55 nuclear power stations, each occupying one square kilometre. That’s about 0.02% of the area of the country. Wind farms delivering the same average power would require 500 times as much land: 10% of the country. If the nuclear power stations were placed in pairs around the coast (length about 3000 km, at 5 km resolution), then there’d be two every 100 km. Thus while the area required is modest, the fraction of coastline gobbled by these power stations would be about 2% (2 kilometres in every 100).
Economics of cleanup
What’s the cost of cleaning up nuclear power sites? The nuclear decommissioning authority has an annual budget of £2 billion for the next 25 years. 10 The nuclear industry sold everyone in the UK 4 kWh/d for about 25 years, 11 so the nuclear decommissioning authority’s cost is 2.3 p/kWh. That’s a hefty subsidy – though not, it must be said, as hefty as the subsidy currently given to offshore wind (7 p/kWh).
Erratum: "The nuclear decommissioning authority has an annual budget of 2 billion." In fact this is to clean up not only the civilian nuclear power stations but also the military nuclear-bomb-making facilities at Sellafield. The lion's share of the money is thus cleaning up military mess, not civilian-power mess. This means I have overestimated the cost per kWh of cleaning up old civilian nuclear power.Safety
The safety of nuclear operations in Britain remains a concern. The THORP reprocessing facility at Sellafield, built in 1994 at a cost of £1.8 billion, had a growing leak from a broken pipe from August 2004 to April 2005. Over eight months, the leak let 85 000 litres of uranium-rich fluid flow into a sump which was equipped with safety systems that were designed to detect immediately any leak of as little as 15 litres. But the leak went undetected because the operators hadn’t completed the checks that ensured the safety systems were working; and the operators were in the habit of ignoring safety alarms anyway.
The safety system came with belt and braces. Independent of the failed safety alarms, routine safety-measurements of fluids in the sump should have detected the abnormal presence of uranium within one month of the start of the leak; but the operators often didn’t bother taking these routine measurements, because they felt too busy; and when they did take measurements that detected the abnormal presence of uranium in the sump (on 28 August 2004, 26 November 2004, and 24 February 2005), no action was taken.
By April 2005, 22 tons of uranium had leaked, but still none of the leak-detection systems detected the leak. The leak was finally detected by accountancy, when the bean-counters noticed that they were getting 10% less uranium out than their clients claimed they’d put in! Thank goodness this private company had a profit motive, hey? The criticism from the Chief Inspector of Nuclear Installations was withering: “The Plant was operated in a culture that seemed to allow instruments to operate in alarm mode rather than questioning the alarm and rectifying the relevant fault.” 12

If we let private companies build new reactors, how can we ensure that higher safety standards are adhered to? I don’t know.
At the same time, we must not let ourselves be swept off our feet in horror at the danger of nuclear power. Nuclear power is not infinitely dangerous. It’s just dangerous, 13 much as coal mines, petrol repositories, fossil-fuel burning and wind turbines are dangerous. Even if we have no guarantee against nuclear accidents in the future, I think the right way to assess nuclear is to compare it objectively with other sources of power. Coal power stations, for example, expose the public to nuclear radiation, because coal ash typically contains uranium. Indeed, according to a paper published in the journal Science, people in America living near coal-fired power stations are exposed to higher radiation doses than those living near nuclear power plants. 14
When quantifying the public risks of different power sources, we need a new unit. I’ll go with “deaths per GWy (gigawatt-year).” Let me try to convey what it would mean if a power source had a death rate of 1 death per GWy. One gigawatt-year is the energy produced by a 1 GW power station, if it operates flat-out for one year. Britain’s electricity consumption is roughly 45 GW, or, if you like, 45 gigawatt-years per year. So if we got our electricity from sources with a death rate of 1 death per GWy, that would mean the British electricity supply system was killing 45 people per year. For comparison, 3000 people die per year on Britain’s roads. So, if you are not campaigning for the abolition of roads, you may deduce that “1 death per GWy” is a death rate that, while sad, you might be content to live with. Obviously, 0.1 deaths per GWy would be preferable, but it takes only a moment’s reflection to realize that, sadly, fossil-fuel energy production must have a cost greater than 0.1 deaths per GWy – just think of disasters on oil rigs; helicopters lost at sea; pipeline fires; refinery explosions; and coal mine accidents: there are tens of fossil-chain fatalities per year in Britain.
So, let’s discuss the actual death rates of a range of electricity sources. The death rates vary a lot from country to country. In China, for example, the death rate in coal mines, per ton of coal delivered, is 50 times that of most nations. Figure 24.11 shows numbers from studies by the Paul Scherrer Institute and by a European Union project called ExternE, which made comprehensive estimates of all the impacts of energy production. According to the EU figures, coal, lignite, and oil have the highest death rates, followed by peat and biomass-power, with death rates above 1 per GWy. Nuclear and wind are the best, with death rates below 0.2 per GWy. 15 Hydroelectricity is the best of all according to the EU study, but comes out worst in the Paul Scherrer Institute’s study, because the latter surveyed a different set of countries.
Inherently safe nuclear power
Spurred on by worries about nuclear accidents, engineers have devised many new reactors with improved safety features. The GT-MHR power plant, for example, is claimed to be inherently safe; and, moreover it has a higher efficiency of conversion of heat to electricity than conventional nuclear plants [gt-mhr.ga.com].
Mythconceptions
Two widely-cited defects of nuclear power are construction costs, and waste. Let’s examine some aspects of these issues.
Building a nuclear power station requires huge amounts of concrete and steel, materials whose creation involves huge CO2 pollution.
The steel and concrete in a 1 GW nuclear power station have a carbon footprint of roughly 300 000 t CO2. 16
Spreading this “huge” number over a 25-year reactor life we can express this contribution to the carbon intensity in the standard units (g CO2 per kWh(e)),
[\begin{matrix} {\text{carbon\ intensity}\phantom{\text{construction}}} \ \text{associated\ with\ construction} \ {\quad = \ \frac{300 \times 10^{9}\text{~g}}{10^{6}\text{~kW(e)~} \times \text{~220\ 000\ h}}} \ {= \ 1.4\text{~g/kWh(e),}\phantom{\text{constru}}} \ \end{matrix}]
which is much smaller than the fossil-fuel benchmark of 400g CO2/kWh(e). The IPCC estimates that the total carbon intensity of nuclear power (including construction, fuel processing, and decommissioning) is less than 40 g CO2/kWh(e) (Sims et al., 2007).
Please don’t get me wrong: I’m not trying to be pro-nuclear. I’m just pro-arithmetic.
Isn’t the waste from nuclear reactors a huge problem?
As we noted in the opening of this chapter, the volume of waste from nuclear reactors is relatively small. Whereas the ash from ten coal-fired power stations would have a mass of four million tons per year (having a volume of roughly 40 litres per person per year), the nuclear waste from Britain’s ten nuclear power stations has a volume of just 0.84 litres per person per year – think of that as a bottle of wine per person per year (figure 24.13).
Most of this waste is low-level waste. 7% is intermediate-level waste, and just 3% of it – 25 ml per year – is high-level waste.
The high-level waste is the really nasty stuff. It’s conventional to keep the high-level waste at the reactor for its first 40 years. It is stored in pools of water and cooled. After 40 years, the level of radioactivity has dropped 1000-fold. The level of radioactivity continues to fall; after 1000 years, if we reprocess the waste, separating off the uranium and plutonium for use in new nuclear fuel, then after 1000 years, the radioactivity of the high-level waste is about the same as that of uranium ore. Thus waste storage engineers need to make a plan to secure high-level waste for about 1000 years. 17
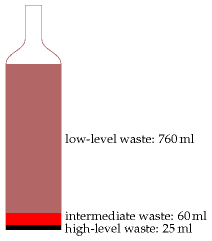
Is this a difficult problem? 1000 years is certainly a long time compared with the lifetimes of governments and countries! But the volumes are so small, I feel nuclear waste is only a minor worry, compared with all the other forms of waste we are inflicting on future generations. At 25 ml per year, a lifetime’s worth of high-level nuclear waste would amount to less than 2 litres. Even when we multiply by 60 million people, the lifetime volume of nuclear waste doesn’t sound unmanageable: 105 000 cubic metres. That’s the same volume as 35 olympic swimming pools. If this waste were put in a layer one metre deep, it would occupy just one tenth of a square kilometre.
There are already plenty of places that are off-limits to humans. I may not trespass in your garden. Nor should you in mine. We are neither of us welcome in Balmoral. “Keep out” signs are everywhere. Downing Street, Heathrow airport, military facilities, disused mines – they’re all off limits. Is it impossible to imagine making another one-square-kilometre spot – perhaps deep underground – off limits for 1000 years?
Compare this 25 ml per year per person of high-level nuclear waste with the other traditional forms of waste we currently dump: municipal waste – 517 kg per year per person; hazardous waste – 83 kg per year per person.
People sometimes compare possible new nuclear waste with the nuclear waste we already have to deal with, thanks to our existing old reactors. Here are the numbers for the UK. The projected volume of “higher activity wastes” up to 2120, following decommissioning of existing nuclear facilities, is 478 000 m3. Of this volume, 2% (about 10 000 m3) will be the high level waste (1290 m3) and spent fuel (8150 m3) that together contain 92% of the activity. Building 10 new nuclear reactors (10 GW) would add another 31 900 m3 of spent fuel to this total. That’s the same volume as ten swimming pools.
If we got lots and lots of power from nuclear fission or fusion, wouldn’t this contribute to global warming, because of all the extra energy being released into the environment?
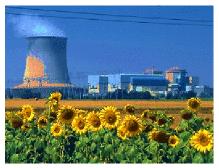
That’s a fun question. And because we’ve carefully expressed everything in this book in a single set of units, it’s quite easy to answer. First, let’s recap the key numbers about global energy balance from chapter 1: the average solar power absorbed by atmosphere, land, and oceans is 238 W/m2; doubling the atmospheric CO2 concentration would effectively increase the net heating by 4 W/m2. This 1.7% increase in heating is believed to be bad news for climate. Variations in solar power during the 11-year solar cycle have a range of 0.25 W/m2. So now let’s assume that in 100 years or so, the world population is 10 billion, and everyone is living at a European standard of living, using 125 kWh per day derived from fossil sources, from nuclear power, or from mined geothermal power. The area of the earth per person would be 51 000 m2. Dividing the power per person by the area per person, we find that the extra power contributed by human energy use would be 0.1 W/m2. That’s one fortieth of the 4 W/m2 that we’re currently fretting about, and a little smaller than the 0.25 W/m2 effect of solar variations. So yes, under these assumptions, human power production would just show up as a contributor to global climate change.
I heard that nuclear power can’t be built at a sufficient rate to make a useful contribution.
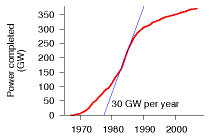
The difficulty of building nuclear power fast has been exaggerated with the help of a misleading presentation technique I call “the magic playing field.” In this technique, two things appear to be compared, but the basis of the comparison is switched halfway through. The Guardian’s environment editor, summarizing a report from the Oxford Research Group, wrote “For nuclear power to make any significant contribution to a reduction in global carbon emissions in the next two generations, the industry would have to construct nearly 3000 new reactors – or about one a week for 60 years. A civil nuclear construction and supply programme on this scale is a pipe dream, and completely unfeasible. The highest historic rate is 3.4 new reactors a year.” 3000 sounds much bigger than 3.4, doesn’t it! In this application of the “magic playing field” technique, there is a switch not only of timescale but also of region. While the first figure (3000 new reactors over 60 years) is the number required for the whole planet, the second figure (3.4 new reactors per year) is the maximum rate of building by a single country (France)!
A more honest presentation would have kept the comparison on a per-planet basis. France has 59 of the world’s 429 operating nuclear reactors, so it’s plausible that the highest rate of reactor building for the whole planet was something like ten times France’s, that is, 34 new reactors per year. And the required rate (3000 new reactors over 60 years) is 50 new reactors per year. So the assertion that “civil nuclear construction on this scale is a pipe dream, and completely unfeasible” is poppycock. Yes, it’s a big construction rate, but it’s in the same ballpark as historical construction rates.
How reasonable is my assertion that the world’s maximum historical construction rate must have been about 34 new nuclear reactors per year? Let’s look at the data. Figure 24.14 shows the power of the world’s nuclear fleet as a function of time, showing only the power stations still operational in 2007. The rate of new build was biggest in 1984, and had a value of (drum-roll please…) about 30 GW per year – about 30 1-GW reactors. So there!
What about nuclear fusion?
We say that we will put the sun into a box. The idea is pretty. The problem is, we don’t know how to make the box.
S´ebastien Balibar, Director of Research, CNRS
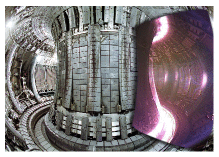
Fusion power is speculative and experimental. I think it is reckless to assume that the fusion problem will be cracked, but I’m happy to estimate how much power fusion could deliver, if the problem is cracked.
The two fusion reactions that are considered the most promising are:
the DT reaction, which fuses deuterium with tritium, making helium; and
the DD reaction, which fuses deuterium with deuterium.
Deuterium, a naturally occurring heavy isotope of hydrogen, can be obtained from seawater; tritium, a heavier isotope of hydrogen, isn’t found in large quantities naturally (because it has a half-life of only 12 years) but it can be manufactured from lithium.
ITER is an international project to figure out how to make a steadily working fusion reactor. The ITER prototype will use the DT reaction. DT is preferred over DD, because the DT reaction yields more energy and because it requires a temperature of “only” 100 million °C to get it going, whereas the DD reaction requires 300 million °C. (The maximum temperature in the sun is 15 million °C.)
Let’s fantasize, and assume that the ITER project is successful. What sustainable power could fusion then deliver? Power stations using the DT reaction, fuelled by lithium, will run out of juice when the lithium runs out. Before that time, hopefully the second installment of the fantasy will have arrived: fusion reactors using deuterium alone.
I’ll call these two fantasy energy sources “lithium fusion” and “deuterium fusion,” naming them after the principal fuel we’d worry about in each case. Let’s now estimate how much energy each of these sources could deliver.
Lithium fusion
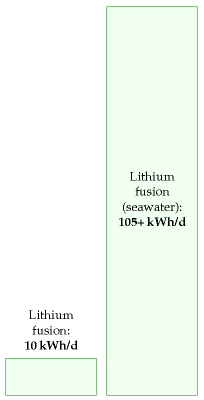
World lithium reserves are estimated to be 9.5 million tons in ore deposits. 18 If all these reserves were devoted to fusion over 1000 years, the power delivered would be 10 kWh/d per person.
There’s another source for lithium: seawater, where lithium has a concentration of 0.17 ppm. 19 To produce lithium at a rate of 100 million kg per year from seawater is estimated to have an energy requirement of 2.5 kWh(e) per gram of lithium. If the fusion reactors give back 2300 kWh(e) per gram of lithium, the power thus delivered would be 105 kWh/d per person (assuming 6 billion people). At this rate, the lithium in the oceans would last more than a million years. 20
Deuterium fusion
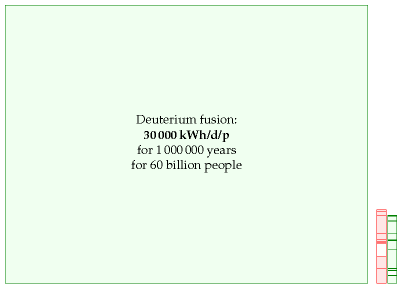
If we imagine that scientists and engineers crack the problem of getting the DD reaction going, we have some very good news. There’s 33 g of deuterium in every ton of water, and the energy that would be released from fusing just one gram of deuterium is a mind-boggling 100 000 kWh. Bearing in mind that the mass of the oceans is 230 million tons per person, we can deduce that there’s enough deuterium to supply every person in a ten-fold increased world population with a power of 30 000 kWh per day (that’s more than 100 times the average American consumption) for 1 million years (figure 24.17).
Notes and further reading
[yju4a4] omits the figure for Turkey, which is found here: [yeyr7z].
Further reading about fission: Hodgson (1999), Nuttall (2004), Rogner (2000), Williams (2000). Uranium Information Center – www.uic.com.au. www.world-nuclear.org, [wnchw]. On costs: Zaleski (2005). On waste repositories: [shrln]. On breeder reactors and thorium: www.energyfromthorium.com.
Further reading about fusion: www.fusion.org.uk, www.askmar.com/Fusion.html.
- Fast breeder reactors obtain 60 times as much energy from the uranium. Source: www.world-nuclear.org/info/inf98. html. Japan currently leads the development of fast breeder reactors.↩
- A once-through one-gigawatt nuclear power station uses 162 tons per year of uranium. Source: www.world-nuclear.org/info/inf03.html. A 1 GW(e) station with a thermal efficiency of 33% running at a load factor of 83% has the following upstream footprint: mining – 16 600 tons of 1%-uranium ore; milling – 191 t of uranium oxide (containing 162 t of natural uranium); enrichment and fuel fabrication – 22.4 t of uranium oxide (containing 20 t of enriched uranium). The enrichment requires 115 000 SWU; see p102 for the energy cost of SWU (separative work units).↩
- it’s been estimated that the low-grade uranium resource is more than 1000 times greater than the 22 million tons we just assumed. Deffeyes and MacGregor (1980) estimate that the resource of uranium in concentrations of 30 ppm or more is 3×10¹⁰ tons. (The average ore grade processed in South Africa in 1985 and 1990 was 150 ppm. Phosphates typically average 100 ppm.) Here’s what the World Nuclear Association said on the topic of uranium reserves in June 2008: “From time to time concerns are raised that the known resources might be insufficient when judged as a multiple of present rate of use. But this is the Limits to Growth fallacy, … which takes no account of the very limited nature of the knowledge we have at any time of what is actually in the Earth’s crust. Our knowledge of geology is such that we can be confident that identified resources of metal minerals are a small fraction of what is there. “Measured resources of uranium, the amount known to be economically recoverable from orebodies, are … dependent on the intensity of past exploration effort, and are basically a statement about what is known rather than what is there in the Earth’s crust. “The world’s present measured resources of uranium (5.5 Mt) … are enough to last for over 80 years. This represents a higher level of assured resources than is normal for most minerals. Further exploration and higher prices will certainly, on the basis of present geological knowledge, yield further resources as present ones are used up.” “Economically rational players will only invest in finding these new reserves when they are most confident of gaining a return from them, which usually requires positive price messages caused by undersupply trends. If the economic system is working correctly and maximizing capital efficiency, there should never be more than a few decades of any resource commodity in reserves at any point in time.” [Exploration has a cost; exploring for uranium, for example, has had a cost of $1–$1.50 per kg of uranium ($3.4/MJ), which is 2% of the spot price of $78/kgU; in contrast, the finding costs of crude oil have averaged around $6/barrel ($1050/MJ) (12% of the spot price) over at least the past three decades.] “Unlike the metals which have been in demand for centuries, society has barely begun to utilize uranium. There has been only one cycle of exploration-discovery-production, driven in large part by late 1970s price peaks. “It is premature to speak about long-term uranium scarcity when the entire nuclear industry is so young that only one cycle of resource replenishment has been required.” www.world-nuclear.org/info/inf75.html Further reading: Herring (2004); Price and Blaise (2002); Cohen (1983). The IPCC, citing the OECD, project that at the 2004 utilization levels, the uranium in conventional resources and phosphates would last 670 years in once-through reactors, 20 000 years in fast reactors with plutonium recycling, and 160 000 years in fast reactors recycling uranium and all actinides (Sims et al., 2007).↩
- Japanese researchers have found a technique for extracting uranium from seawater. The price estimate of $100 per kg is from Seko et al. (2003) and [y3wnzr]; the estimate of $300 per kg is from OECD Nuclear Energy Agency (2006, p130). The uranium extraction technique involves dunking tissue in the ocean for a couple of months; the tissue is made of polymer fibres that are rendered sticky by irradiating them before they are dunked; the sticky fibres collect uranium to the tune of 2 g of uranium per kilogram of fibre.↩
- The expense of uranium extraction could be reduced by combining it with another use of seawater – for example, power-station cooling. The idea of a nuclear-powered island producing hydrogen was floated by C. Marchetti. Breeder reactors would be cooled by seawater and would extract uranium from the cooling water at a rate of 600 t uranium per 500 000 Mt of seawater.↩
- Thorium reactors deliver 3.6×10⁹ kWh of heat per ton of thorium. Source: www.world-nuclear.org/info/inf62.html. There remains scope for advancement in thorium reactors, so this figure could be bumped up in the future.↩
- An alternative nuclear reactor for thorium, the “energy amplifier”… See Rubbia et al. (1995), web.ift.uib.no/~lillestol/Energy_Web/EA.html, [32t5zt], [2qr3yr], [ynk54y].↩
- The nuclear decommissioning authority has an annual budget of £2 billion. In fact, this clean-up budget seems to rise and rise. The latest figure for the total cost of decommissioning is £73 billion. news.bbc.co.uk/1/hi/uk/7215688.stm↩
- The nuclear industry sold everyone in the UK 4 kWh/d for about 25 years. The total generated to 2006 was about 2200 TWh. Source: Stephen Salter’s Energy Review for the Scottish National Party.↩
- The criticism of the Chief Inspector of Nuclear Installations was withering… (Weightman, 2007).↩
- Nuclear power is not infinitely dangerous. It’s just dangerous. Further reading on risk: Kammen and Hassenzahl (1999).↩
- People in America living near coal-fired power stations are exposed to higher radiation doses than those living near nuclear power plants. Source: McBride et al. (1978). Uranium and thorium have concentrations of roughly 1 ppm and 2 ppm respectively in coal. Further reading: gabe.web.psi.ch/research/ra/ra_res.html, www.physics.ohio-state.edu/~wilkins/energy/Companion/E20.12.pdf.xpdf.↩
- Nuclear power and wind power have the lowest death rates. See also Jones (1984). These death rates are from studies that are predicting the future. We can also look in the past. In Britain, nuclear power has generated 200 GWy of electricity, and the nuclear industry has had 1 fatality, a worker who died at Chapelcross in 1978 [4f2ekz]. One death per 200 GWy is an impressively low death rate compared with the fossil fuel industry. Worldwide, the nuclear-power historical death rate is hard to estimate. The Three Mile Island meltdown killed no-one, and the associated leaks are estimated to have perhaps killed one person in the time since the accident. The accident at Chernobyl first killed 62 who died directly from exposure, and 15 local people who died later of thyroid cancer; it’s estimated that nearby, another 4000 died of cancer, and that worldwide, about 5000 people (among 7 million who were exposed to fallout) died of cancer because of Chernobyl (Williams and Baverstock, 2006); but these deaths are impossible to detect because cancers, many of them caused by natural nuclear radiation, already cause 25% of deaths in Europe. One way to estimate a global death rate from nuclear power worldwide is to divide this estimate of Chernobyl’s deathtoll (9000 deaths) by the cumulative output of nuclear power from 1969 to 1996, which was 3685 GWy. This gives a death rate of 2.4 deaths per GWy. As for deaths attributed to wind, Caithness Windfarm Information Forum www.caithnesswindfarms.co.uk list 49 fatalities worldwide from 1970 to 2007 (35 wind industry workers and 14 members of the public). In 2007, Paul Gipe listed 34 deaths total worldwide [www.wind-works.org/articles/BreathLife.html]. In the mid-1990s the mortality rate associated with wind power was 3.5 deaths per GWy. According to Paul Gipe, the worldwide mortality rate of wind power dropped to 1.3 deaths per GWy by the end of 2000. So the historical death rates of both nuclear power and wind are higher than the predicted future death rates.↩
- The steel and concrete in a 1 GW nuclear power station have a carbon footprint of roughly 300 000 t CO2. A 1 GW nuclear power station contains 520 000 m3 of concrete (1.2 million tons) and 67 000 tons of steel [2k8y7o]. Assuming 240 kg CO2 per m3 of concrete [3pvf4j], the concrete’s footprint is around 100 000 t CO2. From Blue Scope Steel [4r7zpg], the footprint of steel is about 2.5 tons of CO2 per ton of steel. So the 67 000 tons of steel has a footprint of about 170 000 tons of CO2.↩
- Nuclear waste discussion. Sources: www.world-nuclear.org/info/inf04.html, [49hcnw], [3kduo7]. New nuclear waste compared with old. Committee on Radioactive Waste Management (2006).↩
- World lithium reserves are estimated as 9.5 million tons. The main lithium sources are found in Bolivia (56.6%), Chile (31.4%) and the USA (4.3%). www.dnpm.gov.br↩
- There’s another source for lithium: seawater… Several extraction techniques have been investigated (Steinberg and Dang, 1975; Tsuruta, 2005; Chitrakar et al., 2001).↩
- Fusion power from lithium reserves. The energy density of natural lithium is about 7500 kWh per gram (Ongena and Van Oost, 2006). There’s considerable variation among the estimates of how efficiently fusion reactors would turn this into electricity, ranging from 310 kWh(e)/g (Eckhartt, 1995) to 3400 kWh(e)/g of natural lithium (Steinberg and Dang, 1975). I’ve assumed 2300 kWh(e)/g, based on this widely quoted summary figure: “A 1 GW fusion plant will use about 100 kg of deuterium and 3 tons of natural lithium per year, generating about 7 billion kWh.” [69vt8r], [6oby22], [63l2lp].↩